Difference between revisions of "Odisha Revenue Department"
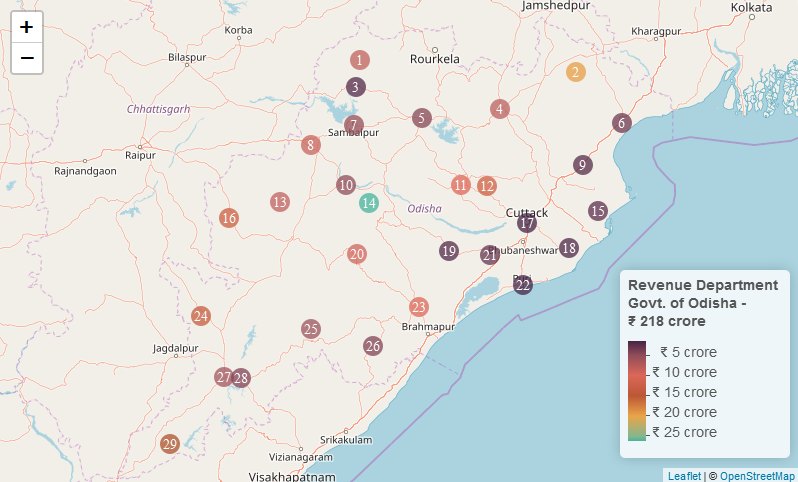
(Plot, Table generated.) |
(No difference)
|
Revision as of 08:33, 9 October 2018
| # | District | Area (acre) | Value (₹ crore) |
|---|---|---|---|
| 1 | Sundargarh | 19,275 | 7.8 |
| 2 | Mayurbhanj | 48,579 | 19.65 |
| 3 | Jharsuguda | 5,002 | 2 |
| 4 | Keonjhar | 17,876 | 7.2 |
| 5 | Deogarh | 11,325 | 4.5 |
| 6 | Balasore | 8,395 | 3.4 |
| 7 | Sambalpur | 12,728 | 5.2 |
| 8 | Bargarh | 20,557 | 8.3 |
| 9 | Bhadrak | 5,640 | 2.25 |
| 10 | Sonepur | 12,346 | 5 |
| 11 | Angul | 25,397 | 10.25 |
| 12 | Dhenkanal | 33,281 | 13.5 |
| 13 | Bolangir | 18,930 | 7.6 |
| 14 | Boudh | 64,597 | 26 |
| 15 | Kendrapara | 6,366 | 2.5 |
| 16 | Nuapada | 33,861 | 13.75 |
| 17 | Cuttack | 3,715 | 1.5 |
| 18 | Jagatsinghpur | 4,576 | 1.85 |
| 19 | Nayagarh | 5,376 | 2.15 |
| 20 | Kandhamal | 22,267 | 9 |
| 21 | Khurda | 7,446 | 3 |
| 22 | Puri | 3,726 | 1.5 |
| 23 | Ganjam | 24,954 | 10 |
| 24 | Nabarangpur | 35,473 | 14.35 |
| 25 | Rayagada | 13,707 | 5.5 |
| 26 | Gajapati | 10,589 | 4.25 |
| 27 | Jeypore | 14,239 | 5.75 |
| 28 | Koraput | 10,547 | 4.25 |
| 29 | Malkangiri | 39,956 | 16 |
| Total | 5,40,725 acre | ₹ 218 crore | |
- ↑ GoI, UNDP, "Status Report: Land Right and Ownership in Orissa", Odisha Revenue Department, 2008
